November 2026 · 7 min read
Same model, same tasks, 9x the cost per task
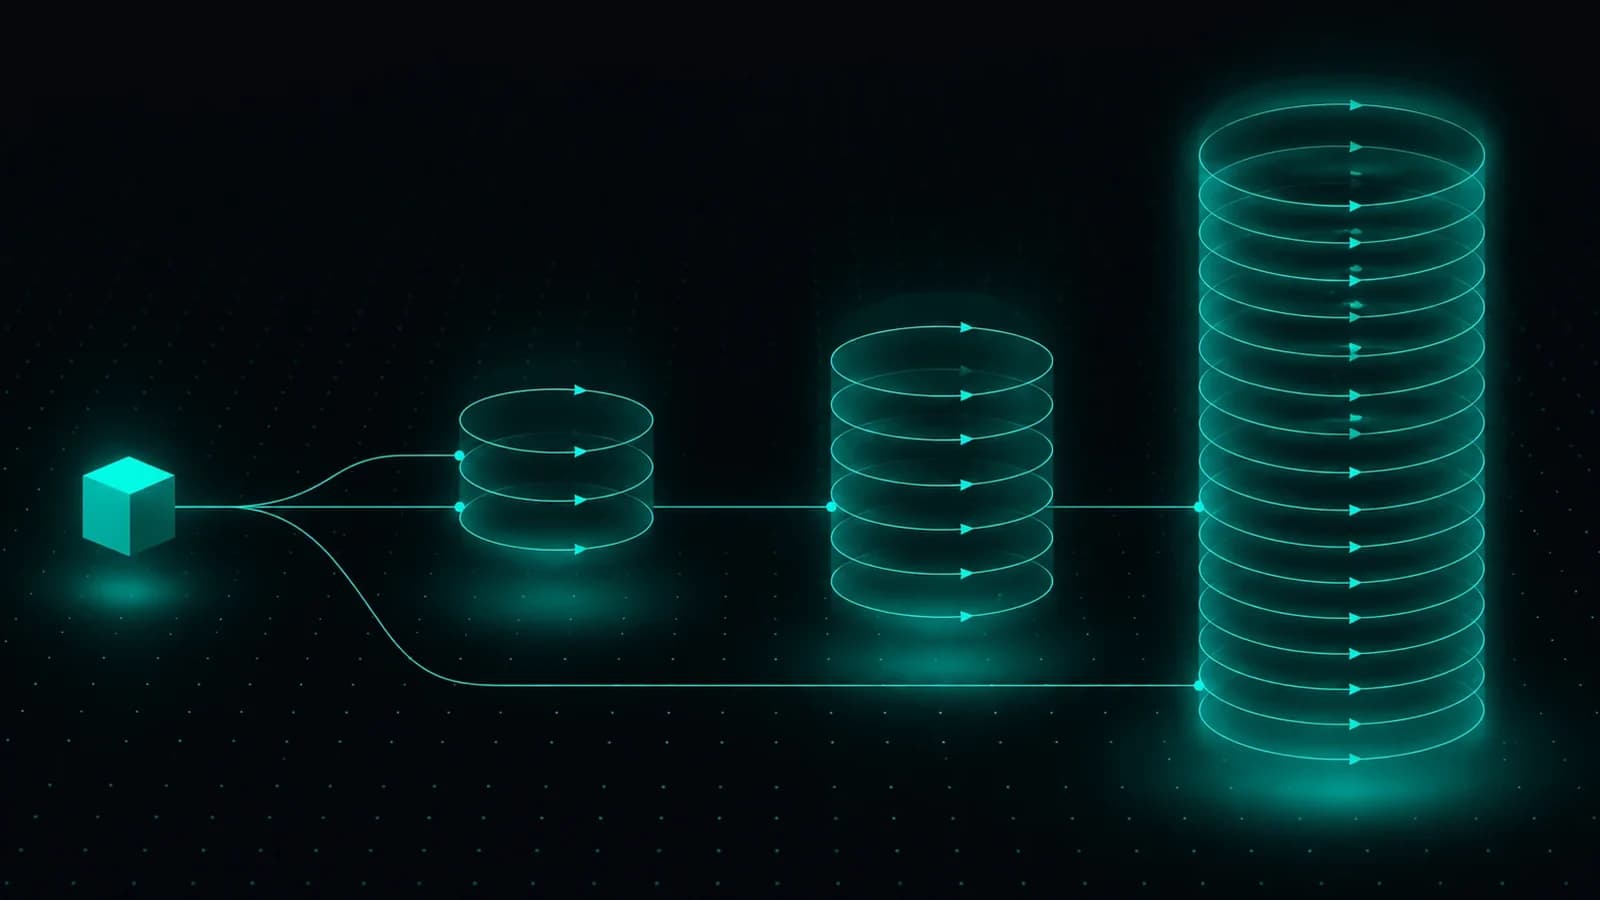
Key definitions
Agent harness The engineering layer around a model that turns one task into many turns: how the system prompt is assembled, how tool output enters context, how history is compressed, and where a failed run replays from. The same model in two harnesses can differ by an order of magnitude in cost per task.
Cost per successful task Total token spend over a period divided by the number of tasks that passed verification. It folds unit price and consumption into one comparable number, which is closer to what the buyer actually pays than a seat or per-token quote.
Context re-send On every turn of a multi-turn task, the earlier conversation and tool output are sent to the model again. Input tokens therefore accumulate with the turn count rather than with new content, which is the main reason agent bills run five to thirty times a chatbot’s.
Two quotes sat side by side in a procurement review: one at 22 cents per task, one at two dollars. Both ran the same model, same version, same reasoning level, same tools. There was no model premium in the gap. The difference came from the layer wrapped around the model: how context gets handed in, when tools get called, and which part of a failed run gets replayed. In engineering that layer is called the harness.
The numbers come from Tokenstead, a harness leaderboard that runs one model through several harnesses on a fixed task set. A task passes only when its verify script exits zero. On 28 tasks, Kimi Code passed 22, burned a median 61k tokens and cost $0.22 per task. Hermes Agent passed 21 at 67k tokens and $0.28. Claude Code passed 20 at 340k tokens and $2.00. Eight points of success separate the three; nine times the cost does.
Read those rows with care. The leaderboard states that they are seeded from Composio’s published test, repriced under one convention with per-token prices attached so anyone can multiply back. That is not independent replication, so everything below leans on the cost half of the evidence. Where the success half appears, it is marked as unreliable.
Composio’s own run was slightly larger: eight harnesses, 25 tasks, the same Kimi K3, identical tool set and reasoning level. Pass rates ran from 88% at the top to 68% at the bottom. Hermes had the lowest total cost at $9.28 for 20 completed tasks, or $0.46 per successful task. Two data sets, one direction: pass rates bunch into a narrow band while cost spreads across an order of magnitude.
Two variables with different shapes
This is worth treating as a structural change because the two variables have different shapes. Success has compressed into a band from roughly 68% to 88%: put a current frontier model inside any competent harness and it gets most tasks right. Cost has spread across a factor of nine on the same tasks and the same model, from $0.22 to $2.00.
Buyers keep comparing models, because models have leaderboards, version numbers and launch events. The harness has none of that. It lives inside the engineering, and on a purchase order it usually takes one line as an implementation detail. That one line sets the bill.
This is not an argument that the harness matters more than the model. The model decides whether a task can be done at all; the harness decides what one correct run costs and how long it takes. Before 2025 the first question had no answer, so every conversation was about models. By late 2026 the first question is settled for most routine work, and attention has not moved yet.
Where nine times comes from
The mechanism is a multiplication. The number of turns a task runs, times the amount of history resent on each turn, gives the input tokens. Take a 20-turn task that carries 8,000 tokens of context per turn (system prompt, tool definitions, conversation, the file it just read). That is around 160k input tokens, and each later turn is more expensive than the one before, because history only grows.
It is easier to see when the turns are laid out. Suppose each turn adds 4,000 tokens of tool output and the harness compresses nothing: turn k carries everything before it, so 20 turns total roughly 840k input tokens. Now suppose another harness summarizes history down to 6,000 tokens every six turns; the same task lands near 300k. Close to a threefold gap produced by one compression policy, with the model untouched. These two figures are arithmetic illustrations, not measurements, and they are here to show where the magnitude comes from.
Four small decisions inside the harness produce that: whether tool output is truncated, whether history is summarized, whether a subtask starts with a clean context, and whether a retry replays the whole run or resumes from a checkpoint. Each saves a modest percentage. Multiplied together, they become the factor.
The reverse also holds. A harness can cut tokens aggressively, but each cut removes information the model needed, so success drops, and past some point the savings cost less than the rework. The Claude Code row in that leaderboard bends the other way: five times the tokens for one point less success, which suggests a context policy that is neither cheap nor accurate, mostly because nobody changed the default.
Latency comes from the same multiplication
The same table also carries time. One model, median 179, 297 and 348 seconds per task. Those numbers do not follow the token counts, because part of the gap sits outside inference: how calls wait on each other, whether they can run concurrently, and whether a failure restarts the run. Waiting time scales with utilization in a queue, and model calls behave the same way, so more serial turns make the tail harder to predict. Read cost and time together; a harness report that only gives cost usually hid its latency inside concurrency.
Our own bill shows the same shape
Over five months our agent system made 189,417 model calls and consumed 13.4 billion input tokens. The text the model actually wrote was 5.01% of the total. The money went to handing context back in, not to generating. That ratio was not chosen by the model; the runtime chose it. We took that bill apart once before and found that caching and context layout move spend more than the token price does. The cross-harness leaderboard supplies the other half: the same layout differences multiply when you change harnesses.
What makes this internal number useful is that it shows the difference is structural rather than one vendor’s misconfiguration. Change how context is organized and the bill changes, whoever supplies the model.
A cheaper model does not fix it
The common inference is that halving the token price makes the problem go away. It runs the other way. A lower price unlocks more expensive habits: longer context, more turns, less truncation, because each step still looks cheap. Complexity and consumption rise together, and the bill follows. Gartner put the number in August at more than fivefold growth in inference cost per agentic workflow through 2028, for a plain reason: unit economics improve while total cost rises.
What that forecast leaves out is how unevenly the multiple lands across harnesses. Turn counts and context volume are harness properties, so the dividend from cheaper tokens does not distribute evenly. A conservative harness keeps it; an aggressive one spends it, then explains to finance why the unit price fell 30% while the bill rose.
On small samples, trust the multiple, not the ratio
The limits here need stating, or the data gets used as an industry verdict. Twenty-five to 28 tasks, one model, one provider, editorial rather than peer reviewed. At n=28, eight points is a little over two tasks; one resampling can erase it. Claims about which harness is more accurate do not survive that.
Nine times is different. Cost is continuous, a median is insensitive to one odd task, and 61k against 340k does not vanish when two tasks change. The same rule applies to every agent benchmark you read: on small samples, look at multiples, not ratios. If you need a ratio, extend the task set into the hundreds and stratify by task type.
One more trap: leaderboards often disagree on success because their task sets differ, not because someone measured wrong. A harness that is strong on code and weak in a browser averages into a number that says nothing. Align the task set before comparing. If it cannot be aligned, compare cost only.
Three changes in how you buy
First, price per successful task. Seats and tokens both leave a harness-controlled variable outside the contract. Ask for three things: the task set, the verification script, and the per-task median token count. Missing any one of them, the quote cannot be compared.
Second, treat the harness as a replaceable engineering component. Models are often pinned by data residency and compliance; harnesses are usually open source or at least runnable in your own environment. Swapping one costs far less and pays a factor, not a percentage. This is especially true for in-house teams: you cannot change a model’s decoding strategy, but you can change the history compression threshold.
Third, run it yourself. Twenty real tickets or twenty real code changes with one automatic pass condition will give you your own row in half a day. A leaderboard can tell you the gap exists. It cannot tell you whether your gap is three times or nine.
A prediction that can be falsified
If the mechanism is turns times context, then longer tasks with more tools should widen the gap between harnesses, not narrow it. Two things should follow within a year: cost converges at the short end, and the spread on long tasks moves from single-digit multiples into double digits. Context management should also become a selling point for harnesses rather than a footnote in a model card.
The prediction can be broken. Take one real task that runs past 40 turns, run it ten times in each of two harnesses, and if the cost gap falls inside a factor of two, this explanation is wrong and something else is driving it.
Our judgment
Our judgment is that the cost competition in agents moved from the model layer to the runtime layer in the second half of 2026. The price war pushed unit prices low enough that they are no longer the main variable in a purchase decision. What remains is how many turns each task runs and how much history each turn carries. The harness sets both, and the harness is something the buyer can change.
That also explains a pattern we keep meeting: a company switches to a cheaper model and the bill does not move. They changed the unit price and left consumption alone. Consumption is a function of the harness, and the harness stayed put.
Three things can be done this week. Pull thirty days of calls and tokens from production logs and compute the input share of total spend; above 80% says your problem is context, not model. Run three real tasks through two harnesses, recording turns and input tokens per turn, and get your own row. In the next AI contract, move the unit from seats to successful tasks and attach the verification criteria.
The question for buyers is this: what share of your AI bill goes to generation rather than to handing context back in? Without that number, the next cost reduction is a coin flip between changing the model and changing the harness, and the usual outcome is another price negotiation followed by a quarter of waiting to see whether the bill moved.
References
RuntimeWire, 6x token gap between agent harnesses (same task set, 61k vs 340k median tokens)
FAQ
Why can the same model cost nine times more in a different harness+
The harness sets how many turns a task runs and how much history each turn carries, and input tokens are the product of the two. Compression policy, tool-output truncation, subtask isolation and retry strategy each shift it a little; multiplied together they become the factor.
Is the success gap as large as the cost gap+
No. On the same 28 tasks the three harnesses land between 71% and 79%. Eight points at that sample size cannot rank them, while the cost gap holds.
Does a cheaper model solve it+
A lower unit price unlocks longer context and more turns, so consumption rises and the bill may not fall. Unit price and consumption are separate, and consumption belongs to the harness.
What unit should procurement compare harnesses on+
Cost per successful task. Ask for the task set, the verification script and the median tokens per task. Seats and per-token quotes both leave the harness variable outside the contract.
What can an in-house team actually change+
The history compression threshold, the truncation length for tool output, context isolation for subagents, and where a retry resumes. None of those require touching the model; they are switches in your own code.
How far can this evidence be trusted+
Twenty-five to 28 tasks, one model, editorial rather than peer reviewed, so the accuracy ranking is unreliable. Cost is continuous and median-based, so the ninefold finding is stable.
Run the same check on your own execution log
Send a redacted 30-day agent execution log and get an eight-row table in 48 hours: one row per technical item, each cell carrying its numerator, denominator and criterion, gaps sorted by whether a schema change is needed. First three engagements are $1,200.
Related articles
Our agent token bill: 95% is rereading
189,417 calls and 13.4B prompt tokens in five months: model output was 5.01%. The composition decides which cost fixes actually work.
Context layout beats model price on agent cost
2026 evidence: caching cut agent costs 41-80%; a 7%→84% hit-rate refactor saved 59%; 4-min keepalives beat 30-s pings. Hit rate, not token price, drives cost.
Inference cost per workflow is the paradox
Gartner sees per-workflow inference cost up fivefold by 2028. Datadog telemetry: 69% of input tokens are system prompts, only 28% of calls hit cache.
Agent failures live in the harness, not the model
monday.com’s feedAgent case (engineering blog): failure modes live in the harness, not the model. Our take: the harness decides production readiness.