September 2026 · 5 min read
AI agent timeout: failures are bimodal, not slow
Key Definitions
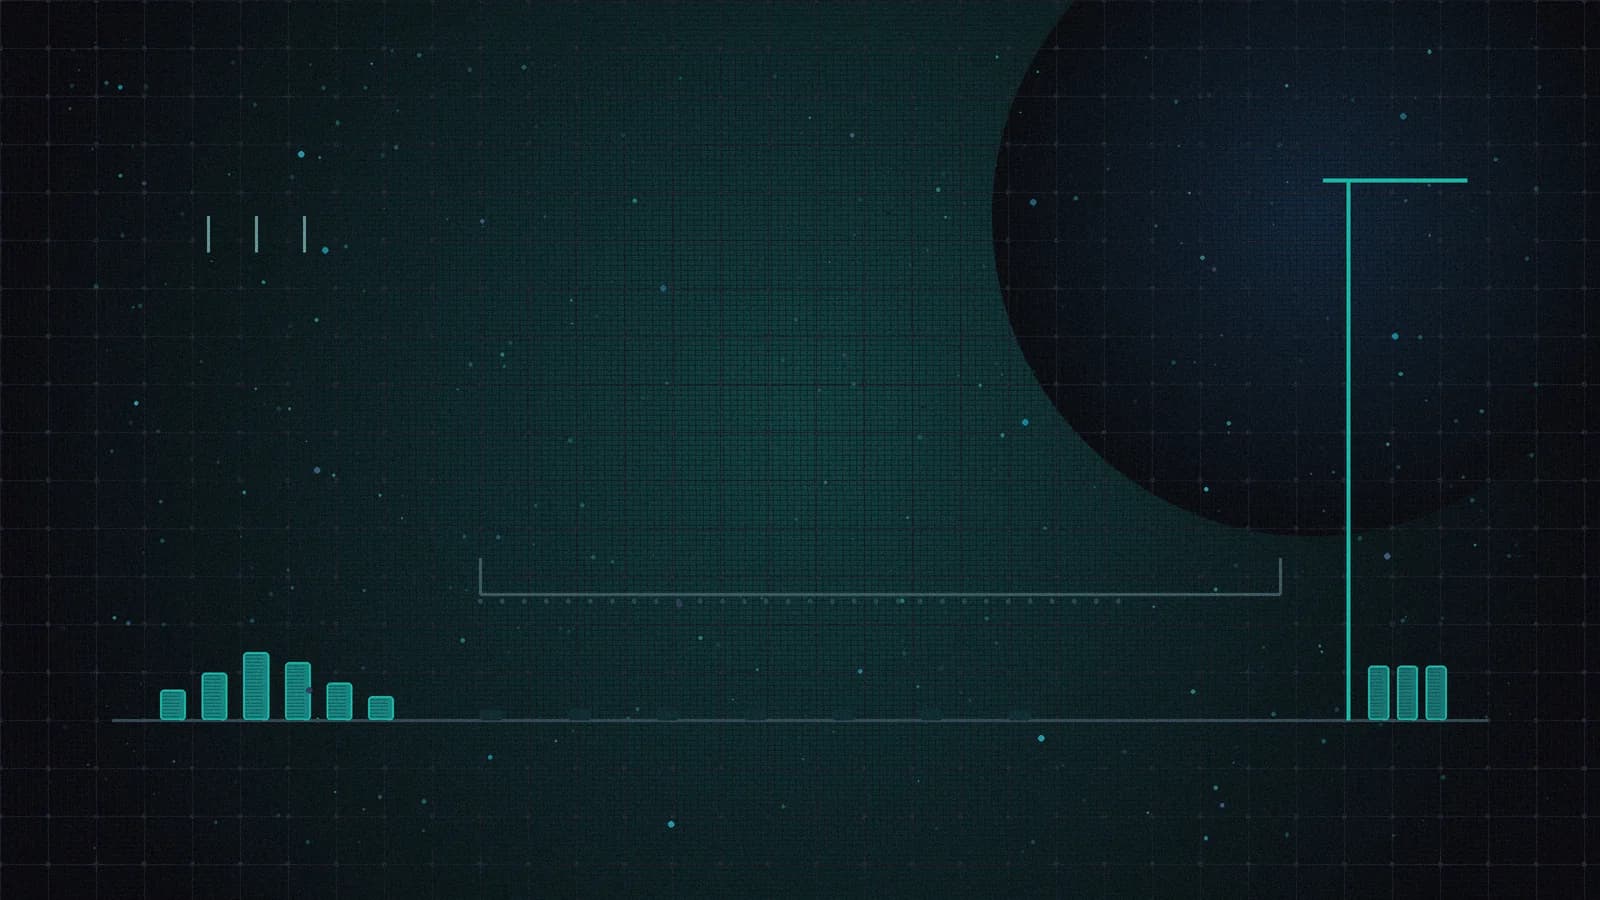
Bimodal failure distribution Failed calls do not cluster around a mean; they form two modes, one returning an error within seconds and one sitting at the timeout cap. The two modes have different causes and need different handling.
Timeout cap as a classifier Counting cap-hit calls separately to separate a call that returned an error from a call that never returned. The first may succeed on retry, the second will not.
How long does a failed tool call take? We went through 2.6 days of our own agent fleet logs, and the 423 failures answered in two piles: 0.4 seconds, or 180 seconds. Almost nothing in between.
What the 423 failures are
The sample is 423 tool calls that returned an error in OOMeta’s own fleet log, with durations read from each line’s own timing field, over a 2.6-day window from 21 to 23 September 2026. One caveat matters: this file records failures only, so successful call durations are absent. What follows describes the shape of the failures, not of all traffic.
Two modes, not a long tail
Laid out as percentiles: p25 is 0.35 seconds, the median is 1.63 seconds, p75 jumps to 37.96 seconds, p90 is 180.55 seconds, p95 is 182.11 seconds, and the longest single call logged 1,876.89 seconds.
As shares it is clearer: 53 percent of failures returned within 2 seconds, 16 percent sat at 170 seconds or more, and the middle accounted for 31 percent. That wide gap between the two clusters is the tell that these are not the same failure.
The fast mode is a command that was wrong: a missing path, a bad argument, a command blocked by a safety gate. The slow mode is a call that never returned: waiting on the network, on a lock, on input to an interactive command. Eighty-eight failures are written up as command timeouts, and 48 carry exit code 124, the system-level timeout verdict.
The two modes react to retries in opposite directions. A fast failure often clears on retry because the state was simply not ready. A cap-hit retry is wasted motion, because the previous attempt never came back and the next one will most likely wait in the same place.
Why the average is the worst input here
Set one global timeout from the average duration and both modes get misjudged. The fast cluster never needed that much time, and the slow cluster will not return no matter how long it waits. The average sits in the empty gap, which is precisely the least informative place to stand.
Our judgment
- Use the cap as a classifier. Count cap-hit calls separately, and treat them as interrupt-and-redesign rather than retry-and-hope.
- Budget per tool class, never one global number. Terminal commands, file reads and external APIs differ in time scale by two orders of magnitude. One number lets the slow ones through and makes the fast ones wait.
- Write never returned into the runbook as its own failure class. Its response is the opposite of returned an error, and mixing them in one handler drags both down.
One question for buyers
How many timeout values does your agent have today? If the answer is one, two failure classes with opposite remedies are already sharing a single handler. Do not start by tuning the number. Split the two clusters into separate counters first, and you will know immediately whether the fix belongs in the retry policy or in the tool itself.
OOMeta AI
We allocate time budgets per tool class and count cap-hit calls on their own, so a blocked wait and a two-second error enter different handling paths instead of sharing one average timeout.
Book a diagnostic sessionCaliber and sources: every figure comes from OOMeta’s own agent fleet runtime log, first-hand, with no third-party vendor data. To reproduce: the log file at ~/.hermes/logs/errors.log, retained window 2026-09-21 07:18 to 2026-09-23 20:01 CST (1.4 MB, 16,787 lines); the sample is the 423 lines matching Tool returned error, with the duration read from that line’s timing field; timeout counts come from the Command timed out string and from exit code 124; collected 2026-09-23 20:10 CST. Log rotation changes the sample size, so a fresh run will match this caliber rather than these exact numbers. External caliber references: the exit code 124 timeout semantics are documented in the GNU coreutils timeout manual at gnu.org/software/coreutils/manual/html_node/timeout-invocation.html (curl HTTP 200), and HTTP 429 is defined in rfc-editor.org/rfc/rfc6585 section 4 (curl HTTP 200). Both are terminology references; no figure here depends on third-party data.
Frequently Asked Questions
What is the sample and window?+
423 failed tool calls with durations taken from the log line timing field, over a 2.6-day window from 21 to 23 September 2026. The file records failures only, so successful call durations are not part of it.
What is the median?+
1.63 seconds, with a p25 of 0.35 seconds. More than half of all failures returned an error within two seconds.
How slow is the slow mode?+
p75 jumps to 37.96 seconds, p90 is 180.55 seconds, p95 is 182.11 seconds, essentially pinned to the timeout cap, and the longest call logged 1,876.89 seconds.
Why not set the timeout from the average?+
The average lands in the empty gap between the two modes. It lets non-returning calls through while making fast failures wait, getting both ends wrong.
How should cap-hit calls be handled?+
Treat them as blocked waits: count them separately, interrupt them, and find out what they were waiting on. Retrying will not change the outcome of a call that never returned.
Related Articles
Why cost per successful task beats token price
Token prices fell 41% since March, yet per-employee AI spend at the heaviest users dropped 10%. Measure cost per successful task, not token price.
Split capacity risk from price risk in AI buying
Alibaba’s CEO says long-term demand far outpaces supply, capped by global supply chains. Tencent priced 2K images at ¥0.15. Capacity and price are separate.
Agent cost control moves to execution layer
Agent cost control moves to execution layer: budget pre-enforcement, per-call routing, full metering. Sapiom’s $35M: dashboards audit, execution layers govern.
NVIDIA buys HF: whose boundary holds the audit trail?
NVIDIA’s $12.9B HF deal ships audits ’below the security boundary’ — all inside its own wall. Vertical integration moves the trust gap; it doesn’t close it.